Water Balance in the study area
The water balance sheets are thought of as a standardized system of documenting all base data that was used for quantifying the water supply and demand for the base year 2002. ARIJ has established a harmonized version of the water supply and use data, using the (few) official data, supplementary data from other data sets, and using estimates to fill in missing data. All water balances from the three domains were linked together into an overall water balance. Standard water quality categories
- Q1: drinking water
- Q2: non-drinking water with unlimited use in agriculture
- Q3: non-drinking water with limited use for agriculture
- Q4: water not usable for any purpose
However, in order to produce a complete picture of water resources and water use in the region, the project team has decided to utilize the following systems (Figure 12): 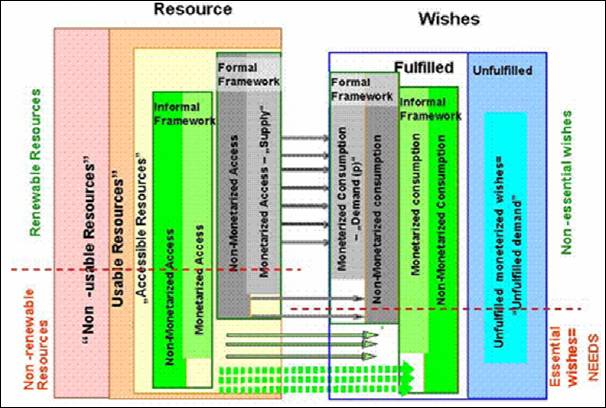
Figure 12: Nomenclature systems as developed following Project Meeting 4 “Non-renewable Resources”: Water that comes from fossil or other nonrenewable resources. “Usable Resources”: This describes the part of the total water resources that could possibly be used by consumer. “Accessible Resources”: This is the part of the usable water that is actually accessible for consumption. It is important to distinguish if access is inside or outside the monetary economic system. “Supply”: This is the part of accessible water resources that is accessible through the monetarized economic system (water has a price). “Informal usage”: This is the part of the accessible water that is available to users through a non-monetarized system. Informal usage can be either monetarized (water has a price) or non-monetarized where water has no price. The total volume of renewable and non-renewable water resources in the Dead Sea Basin excluding the volume of water stored in the Dead Sea was estimated to be approximately 855 MCM/yr of which 216.2 MCM/yr renewable groundwater resources, 421.7 MCM/yr renewable surface water resources, 29 MCM/yr imported renewable resource, 3.7 MCM/yr treated wastewater and 94.6 MCM/yr generated wastewater. Non-renewable resources are approximately 90 MCM/yr. 393 MCM/yr of the total water resource in the Dead Sea basin is Q4 water that is not usable prior to proper treatment for any purpose.
Table 14 renewable and non-renewable water resources in the Dead SeaBasin
|
|
Resource Quality |
GroundBasin Total |
AIES Total |
ECO Total |
ARIJ Total |
Total |
Renewable Resource |
Groundwater |
Q1 |
73.2 |
7.6 |
20.4 |
49.0 |
180.2 |
|
Q2 |
10.6 |
6.8 |
0.0 |
|
Q3 |
89.3 |
0 |
52.7 |
36.6 |
|
Q4 |
7.1 |
0.0 |
7.1 |
0.0 |
|
Surface Water |
Q1 |
0.0 |
0.0 |
0.0 |
0.0 |
421.7 |
|
Q2 |
221.7 |
63.0 |
146.0 |
12.7 |
|
Q3 |
0.0 |
0.0 |
0.0 |
0.0 |
|
Q4 |
200* |
0.0 |
0.0 |
0.0 |
|
Imported Water |
Q1 |
29 |
7 |
0.0 |
22 |
65 |
Q2 |
0 |
0.0 |
0.0 |
0.0 |
Q3 |
36 |
36 |
0.0 |
0.0 |
Q4 |
0.0 |
0.0 |
0.0 |
0.0 |
Treated Wastewater |
Q2 |
0.0 |
0.0 |
0.0 |
0.0 |
3.7 |
Q3 |
3.7 |
1.1 |
1.9 |
0.7 |
Q4 |
Untreated Wastewater |
Q4 |
94.6 |
48.9 |
13.4 |
32.3** |
94.6 |
Non-Renewable |
Groundwater |
Q3 & Q4 |
-99.0 |
-99.0 |
90* |
-99.0 |
90.0 |
|
|
|
Totals |
855.2 |
168.9 |
338.3 |
138.9 |
855.2 |
The total volume of usable water resources in the Dead Sea Basin was estimated from the total volume of renewable and non-renewable water resources using the following set of criteria:
-
Non-renewable groundwater: The Lower Sandstone aquifer of the Dead Sea is considered as a non-renewable resource that discharges water into the Dead Sea through underground water flows. It is conceived that using the available technology, it would be particularly difficult to conceive that technological options would be available to tap this water, desalinate it and use it for any of the water consumption sectors.
-
Renewable groundwater: The volume of renewable groundwater recharging the Upper Limestone Aquifer of the Dead Sea is approximately 87 MCM/yr. Currently, Jordan is over-abstracting the aquifer. Recharge within the ECO-Domain, however, which extends from the Dead Sea eastwards up to 200 m asl contour line, is minimal and less than 5 MCM/yr due to the very low precipitation values in the area. It is estimated that 87 MCM/yr of water is usable in the Dead Sea Basin . The volume of usable groundwater within the study area depends on the level of upstream water abstraction from groundwater wells and from the volume of water discharged from springs and flowing into the study area.
The volume of renewable groundwater recharging the Aquifers to the east of the Dead Sea Basin is approximately 130 MCM/yr. However, within the ARIJ-Domain, the volume of water recharge the Eastern-Mountain Aquifer is approximately 85 MCM. The usable resources are 49 MCM and the brackish water discharged from Fashkha Springs, Turba and Ghwair is approximately 36 MCM/yr. The discharge from Fashkha, Turba and Ghwair are considered unusable due to the prevailing political situation and due to the need to satisfy the needs of nature in the unique habitats of the aforementioned springs.
- Surface water: The criteria for estimating the volume of water that can be tapped and used from surface water utilized the set of criteria proposed by CH2MHILL (2002). According to CH2MHILL (2002), storm water can be captured feasibly for Wadis with an annual discharge greater than 4 MCM/yr. It is further estimated that only 70% of the total runoff can be captured and that 50% of the captured runoff can be feasibly used (CH2MHILL, 2002 and Forward, 1998). Accordingly, the total volume of storm water that can be captured and used from side Wadis is approximately 64.2 MCM/yr of Q2 water and from the Jordan River pending further treatment is 30 MCM/yr.
-
Imported Water: The volume of imported water into the study area is approximately 65 MCM/yr of which 36 MCM is brackish water for industrial use; the remaining volume is Q1 “Drinking Quality Water”. In the future, it can be assumed that competition from water consumers outside the study area can prevent the continuation of the flow of this source into the study area or can at least reduce it.
-
Treated and untreated wastewater: The total volume of wastewater generated in the study area is approximately 87.1 MCM/yr of which only 3.7 MCM/yr is currently being treated. However, the total volume of wastewater would be assumed here as usable if treated and reused.
Table 15 Usable water resources in the Dead SeaBasin
|
Resource |
Resource Quality |
GroundBasin Usable |
AIES Usable |
ECO Usable |
ARIJ Usable |
Total |
Renewable Resource |
Groundwater |
Q1 |
73.2 |
7.6 |
20.4 |
49.0 |
172.5 |
|
Q2 |
10.6 |
6.8 |
0.0 |
|
Q3 |
88.7 |
36.0 |
52.7 |
0.0 |
|
Q4 |
0.0 |
0.0 |
0.0 |
0.0 |
|
Surface Water |
Q1 |
0.0 |
0.0 |
0.0 |
0.0 |
94.2 |
|
Q2 |
64.2 |
10.0 |
51.0 |
3.2 |
|
Q3 |
0.0 |
0.0 |
0.0 |
0.0 |
|
Q4 |
30 |
0.0 |
0.0 |
30 |
|
Imported Water |
Q1 |
0.0 |
0-7 |
0.0 |
0-22 |
36-65 |
Q2 |
0.0 |
0.0 |
0.0 |
0.0 |
Q3 |
0.0 |
36 |
0.0 |
0.0 |
Q4 |
0.0 |
0.0 |
0.0 |
0.0 |
Treated Wastewater |
Q2 |
0.0 |
0.0 |
0.0 |
0.0 |
3.7 |
Q3 |
3.7 |
1.1 |
1.9 |
0.7 |
Q4 |
Untreated Wastewater |
Q4 |
87.1 |
48.9 |
13.4 |
24.8 |
87.1 |
Non-Renewable |
Groundwater |
Q3 & Q4 |
-99.0 |
-99.0 |
0.0 |
-99.0 |
0 |
|
|
|
Totals |
357.5 |
103.6 |
146.2 |
107.7 |
393.5-422 |
Accessible resources in the study area totaled 212.7 MCM/yr. These were calculated based on the information provided by the partners GIS datasets and the Harmonized GIS database. Note that information on groundwater discharge, abstraction and surface water harvesting were provided by the Partners for the study area only and not for the entire Dead Sea Basin as defined by the EXACT Map. The total accessed Drinking water quality by abstraction from groundwater wells is approximately 39.6 MCM/yr. Please note that AIES did not provide information as regards to the location of the Brackish water wells and the author herein cannot determine whether this brackish water is being abstracted from groundwater within the study area or as imported from wells adjacent to the study area but located within the Dead Sea Basin as defined by the EXACT map. Until further elaboration, the brackish wells are considered to be outside the Study area and therefore will be assumed herein as imported water. In addition, several groundwater wells in ECO-Domain did not have abstraction volumes nor a rough estimate was provided by ECO. Accordingly, the level of abstraction from ground water wells in the study area might be much higher than reported in Table 16. Total accessed spring water was 51.9 MCM per year 2002. Partners provided information as regards to spring discharges inside and outside the study area. It should be noted that for many spring discharging water outside the study area, water naturally flows inside the study area and is used for agricultural purposes. Accessed springs discharge water with various qualities. The volume of water discharged of Drinking Water Quality was 22.7 MCM/yr, with Q2 quality 15.2 MCM/yr and with Q3 quality was 14 MCM/yr. It should be noted that in ECO-Domain, a major desalination project is being constructed. The estimated Geographical location in the UTM projection system is X = 744850 and Y = 3522400. Once, this so called “ Zara Ma'in water project ” is finished in 2006, 10 to 15 MCM/year of surface water from Wadi Mujib and Wadi Zara Ma'in will be provided to the potash industries. At the same time, 38 MCM/year will be provide to Amman, Balqa and Madaba governorates with a possible 2 – 4 MCM/year to be used inside Jordanian study area for tourism.
Major water harvesting projects are found to the East of The Dead Sea but outside the study area. The total accessed volume is a renewable 51 MCM/yr. This is Q2 water that is used for several purposes. Small scale water harvesting in cisterns and small reservoirs provide Q1 water with a total volume of approximately 1.82 MCM/yr.
29 MCM/yr of Q1 water are estimated to be imported into the study area, mostly for domestic purposes. As indicated before, it is not clear whether the 36 MCM/yr of brackish water are extracted from the study area or from wells outside the study area. Of the treated 3.7 MCM/yr of wastewater, only 2.045 MCM/yr are being reused.
Table 17 shows water uses in the study area. Agriculture is the major consumer of water with approximately 111 MCM/yr (52% of total water consumed in the study area). The second largest consumer is the industrial sector with 52 MCM/yr (25% of total water consumed in the study area). The domestic sector consumes 44 MCM/yr (21% of total water consumed in the study area) and water use in tourism does not exceed 4.5 MCM/yr (2% of total water use).
Table 16 Accessible water resources in the Dead Sea Study Area
|
|
|
Accessed Resources in Study Area |
Total Accessed Resource |
Accessed Resource AIES-Domain |
Accessed Resource ECO-Domain |
Accessed Resource ARIJ-Domain |
Total |
Renewble Resource |
Groundwater |
Abstraction (wells) |
Q1 |
39.6 |
2.5 |
4.7 |
32.4 |
39.6 |
Q2 |
0 |
0 |
0 |
0 |
0 |
Q3 |
0 |
0 |
0 |
0 |
0 |
Q4 |
0 |
0 |
0 |
0 |
0 |
Discharge (Springs) |
Q1 |
22.7 |
0 |
16.7 |
6 |
22.7 |
Q2 |
15.2 |
1 |
1.4 |
12.8 |
15.2 |
Q3 |
14 |
0 |
14 |
0 |
14 |
Q4 |
0 |
0 |
0 |
0 |
0 |
Surface Water |
From Inside |
Q1 |
1.82 |
0.3 |
0 |
1.52 |
1.82 |
Q2 |
51 |
0 |
51 |
0 |
51 |
Q3 |
0 |
0 |
0 |
0 |
0 |
Q4 |
0 |
0 |
0 |
0 |
0 |
From Outside |
Q1 |
0 |
0 |
0 |
0 |
0 |
Q2 |
0 |
0 |
0 |
0 |
0 |
Q3 |
0 |
0 |
0 |
0 |
0 |
Q4 |
0 |
0 |
0 |
0 |
0 |
Imported Water |
Imported Water |
Q1 |
29 |
7 |
0 |
22 |
29 |
Q2 |
0 |
0 |
0 |
0 |
0 |
Q3 |
36 |
36 |
0 |
0 |
36 |
Q4 |
0 |
0 |
0 |
0 |
0 |
Treated Wastewater |
Treated Wastewater |
Q2 |
0 |
0 |
0 |
0 |
0 |
Q3 |
2.045 |
0.145 |
1.9 |
0 |
2.045 |
Q4 |
0 |
0 |
0 |
0 |
Untreated Wastewater |
Untreated Wastewater |
Q4 |
0 |
0 |
0 |
0 |
0 |
Non-Renewable |
Groundwater |
Groundwater |
Q2 |
0 |
0 |
0 |
0 |
0 |
Q3 |
0 |
0 |
0 |
0 |
0 |
Q4 |
0 |
0 |
1 |
0 |
1 |
|
Totals |
|
212.7 |
47.245 |
90.7 |
74.72 |
212.7 |
Table 17:For more detailed information download excel file Water Uses in the Study Area.
|