Background
The Dead Sea and its
Basin are suffering degradation processes induced mainly by
anthropogenic unsustainable development actions. In the last 30
years, the level of the Dead Sea has dropped more than 20 meters and its
surface area has shrunk by 30%. The reasons for this are well known.
Major water diversion projects of the waters of the Jordan River and of
the Dead Sea side Wadis have reduced fresh water inputs from its
pre-1985 annual average of 1,570 MCM to less than 560 MCM/yr of bad
quality water (Average annual water inputs into the Dead Sea ranged
between 419-559 MCM during the last 6 years). The drop in the Dead Sea
water level has led to the opening up of sinkholes. 32 sinkholes opened
up in recent years alongside the western coast of the Dead Sea (AIES,
2003) and the rate is has been increasing recently. The Dead Sea Basin
is also living up to its name. Groundwater table levels have been
dropping in several well fields at an alarming rate. The groundwater
table in the Herodion Well Field is dropping at an alarming rate. The
observed drop in certain wells exceeded 60 meters in the last 20 years.
Groundwater quality is also degrading because of over abstraction and
pollution. More than 90% of the generated industrial and domestic
wastewater in the Dead Sea Basin is openly discharged without any prior
treatment. Wadi Nar flows with more than 10 MCM/yr of untreated
wastewater which has led to the degradation of the Wadi Bed ecosystem.
Human ever growing needs for freshwater has led the riparian countries
to harvest surface water thus depriving nature from its legitimate use
of water. The Jordan River ecosystem suffered the most. It had a flow
of 1,250 MCM of good quality water in the year 1957. Now it has a flow
of less than 200 MCM/yr of Brackish and Wastewater. The banks of the
Jordan River supported woodlands and underground vegetation of the
Populion Euphraticae and Tamaricetum Jordanis alliance. The river banks
were visited for their historic, cultural and religious values. In
addition, several Dead Sea side Wadis with rainwater storm runoff and/or
with permanent water from springs lost significant volumes of water due
to diversion of water resources for agricultural purposes. Wadi Auja
springs water was completely diverted for agricultural purposes. Ein
Gedi spring water is partially used for agriculture and for industrial
purposes, 35 MCM of fresh water is tapped in the Wadi Mujib Dam. The
consequences of these actions were for some Wadis a striking loss of
above ground green biomass and biodiversity. On the other hand,
overgrazing is a problem in certain areas of the Dead Sea basin.
Overgrazing has led to changes in vegetation structure in grazing
areas. Annuals are being replaced with dwarf spiny vegetation with the
consequences of land degradation, soil erosion and desertification.
Method
The figure below shows the analytical
framework used by the Dead Sea project team to identify biodiversity
important areas in the Dead Sea Basin, biodiversity corridors, to
measure changes in above green biomass in the biodiversity important
areas and to understand the drivers of these changes. In areas
where water diversions have contributed to changes in above green
biomass, the minimum water requirements needed by nature to conserve key
ecological process was as well determined.
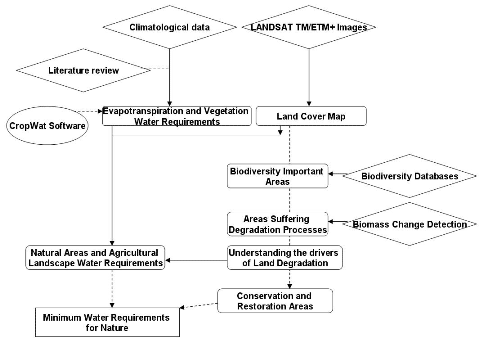
Figure 1:The analytical framework used by the Dead Sea project team
First: A literature review of all available
Biodiversity databases were harmonized and integrated into a GIS and a
biodiversity index map was derived. The Hebrew University Databases
provided a useful source for understanding the distribution of recorded
plant and animal species in the study area. ARIJ flora and Fauna
database listed the IUCN classification of the species into threatened
and endangered species and both Feinbrun’s 1991 Analytical Flora and
Zohary’s Flora Palestina provided information on the abundance of the
different plant species found in the Dead Sea.
Second: The biodiversity index map was used to delineate the
biodiversity important areas and the corridors, located in valley
floors, connecting the biodiversity important areas were as well
delineated. Attention was made that the delineated biodiversity
important areas contained most of the habitats where the endangered,
threatened and rare species were recorded. Zoological and botanic
information on the range of these species was also taken into
consideration.
Third: Information on above ground green biomass changes from the year
1985 to the year 2004 was integrated into the Land cover maps. Natural
areas showing a trend of biomass loss were identified as areas subject
to land degradation processes.
Fourth: Evapotranspiration values for the study area were calculated.
Evapotranspiration are two processes that cannot be separated over land
areas. These are (1) evaporation which is defined as the change of water
state from liquid to vapor. Sunlight aids this process as it raises the
temperature of liquid water. The rate of evaporation is highly variable
and depends of factors such as temperature, humidity of the air mass,
wind speed and amount of solar radiation and (2) Transpiration which is
a biological process whereby plants pull water from the soil and loose
it through evaporation from their tissues through the stomata of the
leaves. Rates of transpiration would be affected by, temperature, wind
speed, humidity, plant type, amount of cover and the amount of water in
the soil. Transpiration proceeds almost entirely by day under the
influence of solar radiation. At night the pores or stomata of plants
close up and very little moisture leaves the plant surfaces.
Evaporation, on the other hand, continues as long as heat input is
available (Wilson, E.M., 1990). The Penman-Montieth method was used for
estimating reference evapotranspiration in the study area after
modification by the Food and Agriculture Organization (FAO) of the
United Nations; The FAO modified the Penman Montieth method and
developed the CROPWAT software to estimate the reference
evapotranspiration. The Modified Penman- Montieth equation can be
simplified as follows:
ET0 = [0.408 D (Rn - G) + g (900/ (T + 273)) U2 (ea - ed)] / D + g (1 +
0.34 U2)
Where:
ET0 : reference crop evapotranspiration (mm/day),
Rn : net radiation at crop surface (MJ /m2/ day),
G : soil heat flux (MJ /m2/ day),
T : average temperature (C°),
U2 : wind speed measured at 2m height (m/s),
(ea - ed) : vapor pressure deficit (Kpa),
D : Slope vapor pressure curve (Kpa/ C°),
g : Psychometric constant (Kpa/ C°) and
900 : conversion factor.
Fifth: In order to calculate the actual water requirements of natural
plant species, the plant species coefficient should be determined.
Different natural plants use varying amounts of water. Little research
has been done to valuate the plant species coefficient (KC) in the
Mediterranean Basin. Accordingly the water needs of plants per species
could not be determined. However, few studies (e.g. Kite et al, 2000)
has estimated the Kc values of Mediterranean plant categories. Ever
green trees native to the Mediterranean climates have a Kc values
between 0.4-0.6. Evergreen shrubs have Kc values range from 0.25-0.5 and
native plants from arid zones Kc values average approximately 0.25. Soil
characteristics as well as vegetation association types and plant
abundance category were used to determine whether the lower or upper
range of Kc should be used. The water needs were determined using the
following equation:
Water Needs = ET0 * Kc
Biodiversity
Important Areas and Corridors
An index of biodiversity important areas was derived. Each record of
endangered species (ES) was assigned a weight of 10, records of very
rare species (VRS) was assigned a weight of 7, records of rare species
(RS) was assigned a weight of 5, and records of other species (OS) was
assigned a weight of 3. The measured above ground green biomass was as
well integrated in the calculation of the biodiversity index map. The
biodiversity index map was generated using the following equation:
Biodiversity Index = 10*ES + 7*VRS + 5*RS + 3*OS +
0.05*Biomass
This resulted in a map highlighting natural areas with high biomass and
species records (Map 1). The index map was used to delineate
biodiversity hot spots and animal and plant corridors (Map 1). The
criterion used for delineating hotspots was the inclusion of 95% of
endangered species, very rare species and rare species habitats. No
data was available for the Jordanian part of the study area, accordingly
the declared natural reserves were observed for the purpose of this
study as biodiversity hot spots and biodiversity corridors.
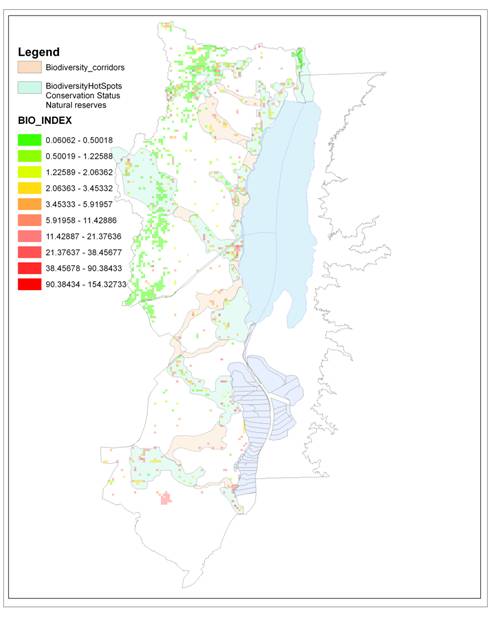
Map 1:
Biodiversity Index map, biodiversity hotspots and biodiversity corridors
Map
2 shows the changes in above ground green biomass between mid 1980s and
mid 2000. It was apparent that the eastern slopes of the West Bank were
most hit by degradation processes. This was mainly due to (1) urban
expansion and (2) overgrazing as these areas are accessible to farmers’
herds. The eastern slopes closer to the Dead Sea either had no changes
in Biomass or a low-moderate increase in above ground green biomass.
This is mainly due to the fact that most of these areas are declared
Israeli natural reserves or military closed areas inaccessible to
farmers’ herds.
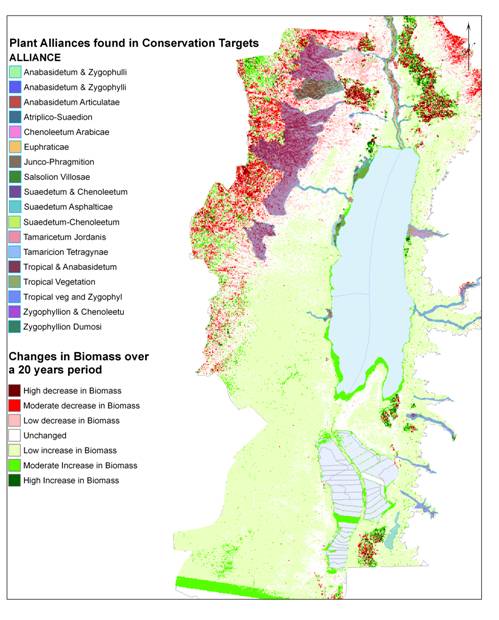
Map
2: Biomass change detection between an averaged biomass for the years
1985 and 1978 and an averaged biomass for the years 2000 and 2004. Areas
with the most negative change are delineated in blue.
Of
all the Biodiversity hot spots and biodiversity corridors; the lower
Jordan valley was the most hit by degradation processes. This is mainly
due to the continuous reduction of water flow through the Jordan River
as more surface runoff is tapped behind dams and (2) the increased level
of pollutants and salt concentrations in the Jordan River which degraded
water quality. Other biodiversity important areas that require immediate
attention and restoration are (1) Wadi Zarqa Main; (2) Wadi Wala; (3)
Wadi Al-Karak; (4) Wadi David (Ein Gedi Area); (5) Al-Fashkha Springs
and Wadi Nar. The latter receives 2.4 MCM/yr of surface runoff but also
receives more than 10 MCM of domestic and industrial wastewater. It
should be noted that the above ground green biomass increase on the Dead
Sea shores cannot be attributed to improved ecological conditions.
Indeed, the positive change in Biomass is due to the recession of the
Dead Sea shores. These areas were covered by water and had an NDVI value
of zero.
Minimum
Water requirements
Jordan river
In the Jordan River, salt concentrations
prior to 1958 averaged 500 mg/l, in April 1959 salt concentrations
reached 2,050 and in June 1960 salt concentrations reached 2,473 mg/l.
In 1958, the banks of the Jordan River and the tributaries pouring into
the Jordan River and the Dead Sea were populated by Populion Euphraticae
and Tamaricetum Jordanis alliances that formed dense and even
impenetrable woods. These plants utilized the lightly brackish water of
the Jordan River and were tolerant to salt deposition on the Banks of
the Jordan River in summer months. However, Populion Euphraticae and
Tamaricetum Jordanis distribution has been greatly reduced due to the
diversion of water and to high increases in salt concentration by more
than 500%.
The volume of water evapotranspirating
from Populion Euphraticae and Tamaricetum Jordanis alliances was
estimated at 130 MCM/yr. Evaporation from the Jordan River course was
estimated at approximately 4.5-6.5 MCM/yr. In the Jordan River Basin,
the texture of the soil changes from north to south, from fine-textured
soil to silt loam and sandy loams immediately
north of the Dead Sea. Water infiltration and percolation rates in
saturated fine textured clay soils can be as low as 0.01 cm/hr and can
increase to approximately 0.25 cm/hr in the saturated sandy loams. Deep
percolation of water through soil increases natural vegetation water
needs as the water becomes inaccessible to vegetation. Percolation
rates in the southern part of the Jordan River are higher than
percolation rates in the northern part of the Lower Jordan River Basin.
Infiltration and percolation from the water course was estimated at 41
MCM/yr. Infiltration and percolation from the inundated banks was
estimated at 45 MCM. The water requirements for the natural vegetation
of the lower Jordan River Basin were therefore estimated at
approximately 222 MCM/yr of good quality water with a total salt
concentration less than 600 mg/l. Technical methods are needed to move
water from the Jordan River bed to the Banks in order to provide natural
vegetation with water. Another option would be to restore the natural
flow of the river of 1,250 MCM/yr that floods the river banks in the
winter season.
Dead Sea
In 1947, the total evaporation from the
surface of the Dead Sea was approximately 1,650 MCM/yr. This was
balanced by the discharge from the Jordan River (1,350 MCM/yr), by
lateral discharges from several Wadis along the Dead Sea Shore (220 MCM/yr)
and by underground lateral water and spring discharges (60-100 MCM/yr).
Major water diversion projects and abstraction of groundwater
drastically reduced the total volume of water discharged into the Dead
Sea. This has led to dramatic changes in the Dead Sea water level and
surface area. Indeed, the level of the Dead Sea dropped by 19 m in the
last 25 years and its surface area shrunk from 1031 square kilometers in
1947 to 634 square kilometers in 2004 (Table 1).
Table 1: Changes in the surface area of the Dead Sea and evaporation ponds as observed from Satellite Images.
|
Year |
Surface Area Dead Sea |
Surface Area Evaporation Ponds/Israel |
Surface Area Evaporation Ponds/Jordan |
Total
Surface Evaporation Area |
|
1947 |
1,031 |
0 |
0 |
1,031 |
|
1965 |
973 |
16 |
0 |
989 |
|
1973 |
925 |
26 |
0 |
951 |
|
1985 |
676 |
139 |
105 |
920 |
|
1987 |
665 |
139 |
92 |
895 |
|
1991 |
655 |
139 |
101 |
894 |
|
1997 |
651 |
150 |
105 |
906 |
|
2000 |
640 |
144 |
116 |
900 |
|
2004 |
634 |
152 |
103 |
888 |
Average total yearly evaporation from the
surface of the Dead Sea between the years 1998-2002 was estimated to
range between 1,100 and 1,240 MCM/yr (Actual evaporation range between
1,250-1,380 mm/yr) of which approximately and approximately 311-351 MCM
of water was pumped to the salting lakes for industrial and recreational
purposes. This resulted in an average drop in the water level of the
Northern Basin of 1.06 cm/yr, the equivalent of 681 MCM of water per
year. Total water inputs from all sources into the Dead Sea ranged
accordingly between 419-559 MCM/yr. Accordingly, the minimum water
requirements to conserve the Dead Sea water level is an increase in
inputs by approximately 680 MCM/yr or by increasing water inputs by some
350 MCM/yr and drying up the evaporation ponds.
Water
marshes
The marshes of Ein-Fashkha and
Ghwair-Turba springs are occupied with the Suaedetea Deserti Class
vegetation mainly formed of the Junco-Phragmition alliance, the
Tamaricion Tetragynae alliance, Atriplico-Suaedion Palaestinae alliance
and the Salsolion Villosae alliance (See Map 7 on page 23). Ein-Fashkha
was declared a natural reserve by the Israeli authorities.
Evapotranspiration from
Ein-Fashkha was estimated at 8 MCM/yr and deep soil percolation was
estimated at 10 MCM/yr. The historic discharge from Ein-Fashkha
averaged 34 MCM/yr. However, two problems face the long term
sustainability of Ein-Fashkha; these are the continuously declining
water discharge due to over abstraction from groundwater in the Herodion
well field and due to the retreating Dead Sea shores. Analysis of
satellite images from 1985 – 2004 has shown that the vegetation of
Ein-Fashkha is being slowly moving eastwards as the Dead Sea shores are
retreating and the vegetation of the Western boundary of Ein-Fashkha is
degrading. Ghwair and Turba marshes are facing similar problems.
Again, it appears that vegetation is being displaced to the east and the
Western Vegetation boundary is degrading. Historic water discharges
from Ghwair and Turba springs combined averaged approximately 26 MCM/yr.
Water discharge volumes are being also reduced due to over abstraction
of ground water. The minimum water requirements to sustain the
vegetation of Ghwair-Turba marshes were estimated at 15 MCM/yr.
Al-Auja Wadi
Of all Wadis in the study area, Wadi Auja
suffered the highest rate of above ground green biomass loss between the
years of 1985 and 2004. This is a loss of natural biomass mostly from
Anabasidetum and Zygophylletum alliances. The water required by
vegetation to conserve the natural vegetation in the Wadi bed and banks
was estimated at 4.1 MCM/yr. Deep percolation beyond the root zone was
estimated at 3.8 MCM/yr. The total water requirement by vegetation is
7.9 MCM/yr. The discharge from the Auja spring averaged 10 MCM/yr and
surface water runoff was estimated by CH2MHILL (2002) to be
approximately 4.6 MCM/yr. Recently, the entire volume of water from
Al-Auja was diverted for agricultural uses. This has dramatic impacts
on the Anabasidetum alliance vegetation. Overgrazing is another problem
around Al-Auja Wadi bed which has severely degraded the Zygophylletum
vegetation.
Surface water runoff in Wadi Nar is
estimated at 2.4 MCM/yr. An additional 10 MCM of domestic and
industrial untreated wastewater are also discharged into Wadi Nar which
has degraded water quality in Wadi Nar and polluted the runnel. This
has led to an overall observed degradation of the ecosystem and a loss
in above green biomass. Treatment of wastewater prior to its open
discharge into the Wadi is important to reverse the degradation process.
|