|
The Dead Sea, Arabic Al-Bahr al-Mayyit, Hebrew Yam HaMelah, is a landlocked salt lake between Jordan,Israel and Palestine. It extends from 35o30’00 to 35o34’05 East and 30o58’01 to 31o46’01 North. Its total area is 898 km2, while its perimeter is approximately 870 km. It now lies some 417 meters below sea level-the lowest elevation and the lowest body of water on the surface of Earth. In the last 30 years, the level of the Dead Sea has dropped more than 20 meters and its surface area has shrunk by 30% and in the last 60 years by 37%. The reasons for this are well known.
Diversion of Water Resources
Prior to the year 1955, the Jordan River discharged an annual flow of 1,200 MCM/yr into the Dead Sea. In the early 1950's, Israel began draining the Huleh marshes (north of the Sea of Galilee). It built the National Water Carrier between 1953 and 1964: a complex of new and existing canals, pipelines and tunnels to convey water from the Sea of Galilee to the coastal plain of Israel and the Negev Desert. In 1961 Jordan began operating the East Ghor Canal in the Jordan Valley to use Yarmuk waters for irrigation further south. Jordan also built the King Talal Dam on the Zarqa River to store water for irrigation. These, in addition to smaller Jordan River valley dams are diverting approximately 120 MCM of fresh water to agricultural uses. Accordingly, the Jordan river system discharge into the Dead Sea is reduced to less than 150 MCM of domestic and industrial sewage and agricultural runoff drain.
In addition, several Wadis along the Dead Sea shores in Jordan, Palestine and Israel that once filled with fresh rainwater in the winter and rushed down to the Dead Sea are dammed and their water diverted to agricultural uses, to the Dead Sea Works and to the Potash Company. Indeed, Jordan have completed or is planning the construction of three dams in Wadi Moujeb (Maximum capacity 42 MCM/yr), Wadi Wala (5 MCM/yr) and Wadi Al Hassa (8 MCM/yr). Israel on the other hand built reservoirs with a total capacity of 1 MCM/yr along the Dead Sea coast.
Finally, the underground lateral water and spring discharges into the Dead Sea were greatly reduced due to water abstraction from wells. Water abstraction from wells located within the Dead Sea Basin is approximately 40 MCM/yr and is planned to increase by another 10-12 MCM in the near future.
In 1947, the total evaporation from the surface of the Dead Sea was approximately 1,650 MCM/yr. This was balanced by the discharge from the Jordan River (1,350 MCM/yr), by lateral discharges from several Wadis along the Dead Sea Shore (220 MCM/yr) and by underground lateral water and spring discharges (60-100 MCM/yr). Major water diversion projects and abstraction of groundwater drastically reduced the total volume of water discharged into the Dead Sea (Figure 1). Indeed, the level of the Dead Sea dropped by 19 m in the last 25 years and its surface area shrunk from 1031 square kilometers in 1947 to 634 square kilometers in 2004 (Table 1).

Evidence exist that persistent years of above average rainfall in the Dead Sea and Jordan River basins have caused dramatic increases in the Dead Sea level. The largest change in water level occurred between about 100 B.C. and A.D. 40. Within this period, the water level of the Dead Sea rose some 70 m, from about 400 m to about 330 m below sea level in about 67 years. Similarly, persistent years of below average rainfall in the Dead Sea and Jordan River basins have caused the water level of the Dead Sea to drop but never below -402 m. The reason, many hypothesize, is that the southern basin of the Dead Sea functioned as a shock absorbent. Whenever the water level of the Dead Sea dropped below 400 m, the shallow Southern Basin of the Dead Sea with a total surface area of approximately 240 square kilometers dried thus reducing the total evaporation surface and balancing water input with total water evaporation. However, the story this time is different. First, major water diversion projects and not dramatic changes in climate reduced water inflow into the Dead Sea. Figure 1 shows the changes of volume of water inflowing into the Dead Sea between 1947 and 2004. Second, the Southern Basin of the Dead Sea was converted to industrial salting lakes (evaporation ponds) with a total surface area of approximately 255 square kilometers where water is pumped from the Northern Dead Sea Basin to the Salting lakes. Accordingly, the Southern Basin is not anymore functioning as a shock absorbent and the total evaporation surface remained at 888 square kilometers in the year 2004 (Table 1).
Table 1: Changes in the surface area of the Dead Sea and evaporation ponds as
observed from Satellite Images.
| Year |
Surface Area Dead Sea |
Surface Area Evaporation Ponds/Israel |
Surface Area Evaporation Ponds/Jordan |
Total Surface Evaporation Area |
| 1947 |
1,031 |
0 |
0 |
1,031 |
| 1965 |
973 |
16 |
0 |
989 |
| 1973 |
925 |
26 |
0 |
951 |
| 1985 |
676 |
139 |
105 |
920 |
| 1987 |
665 |
139 |
92 |
895 |
| 1991 |
655 |
139 |
101 |
894 |
| 1997 |
651 |
150 |
105 |
906 |
| 2000 |
640 |
144 |
116 |
900 |
| 2004 |
634 |
152 |
103 |
888 |
Total yearly evaporation from the surface of the Dead Sea in the year 2002 was estimated to range anywhere between 825-1015 MCM/yr and approximately 330-400 MCM of water was pumped to the salting lakes for industrial and recreational purposes. Accordingly, the total evaporation in the year 2002 was estimated to range between 1155 and 1415 MCM. Total water inputs from the Jordan River, groundwater and surface water runoff (Side Wadis) was approximately 600 MCM. Water deficit ranged therefore between 555-815 MCM causing the water level of the Dead Sea Basin to drop by some 0.9 meters. Table 2 shows the estimated yearly total evaporation from the Dead Sea, the estimated yearly water inputs into the Dead Sea, the yearly drop in the Dead Sea water level and the yearly decrease in the Dead Sea water volume.
Table 2: the yearly drop in the Dead Sea water level, the yearly decrease in the Dead Sea water volume, the estimated yearly total evaporation from the Dead Sea and the estimated yearly water inputs into the Dead Sea.
| Year |
Dead Sea Level (Initial Value at start of 1994 = -407.64 ) |
Yearly Drop in Water Level (meters) |
Water Volume Lost from Northern Basin (MCM) |
Estimated Evaporation (MCM) |
Estimated Water Inputs from Groundwater, Return flow, and Surface Water (MCM) |
| 1994 |
-408.33 |
-0.69 |
451 |
1,167 |
717 |
| 1995 |
-409.17 |
-0.84 |
548 |
1,170 |
622 |
| 1996 |
-410.07 |
-0.9 |
587 |
1,175 |
588 |
| 1997 |
-410.84 |
-0.77 |
501 |
1,178 |
677 |
| 1998 |
-411.9 |
-1.06 |
686 |
1,175 |
489 |
| 1999 |
-413.18 |
-1.28 |
823 |
1,173 |
350 |
| 2000 |
-414.33 |
-1.15 |
736 |
1,170 |
434 |
| 2001 |
-415.39 |
-1.06 |
676 |
1,166 |
490 |
| 2002 |
-416.24 |
-0.85 |
541 |
1,162 |
622 |
As evaporation from the surface of the Dead Sea and from the evaporation ponds exceeds the total water inputs, the water salinity and temperature of the Dead Sea is on a constant rise. Figure 2 below shows the increases in salinity and temperature of the water in the Dead Sea.
Figure 2: Changes in water salinity and Temperature in the Dead Sea Basin.
Overgrazing
Approximately 240,000 grazing sheep and goats are found in the study area. These are mostly found within the West Bank of Palestine. Lower numbers of sheep and goats are found in the Jordanian side of the study area for two main reason, these are: (1) the relatively small surface study area in Jordan and (2) the difficult terrain. In Israel, sheep and goats are Sheep are kept in permanent farms with modern facilities and equipment and therefore not considered as grazing animals.
The large number of sheep and goats in the Palestinian side of the study area coupled with the restrictions on movement of herds in bucolic areas declared by Israel as closed military areas led to the deterioration of pastures accessible to Palestinian farmers (Map 1).
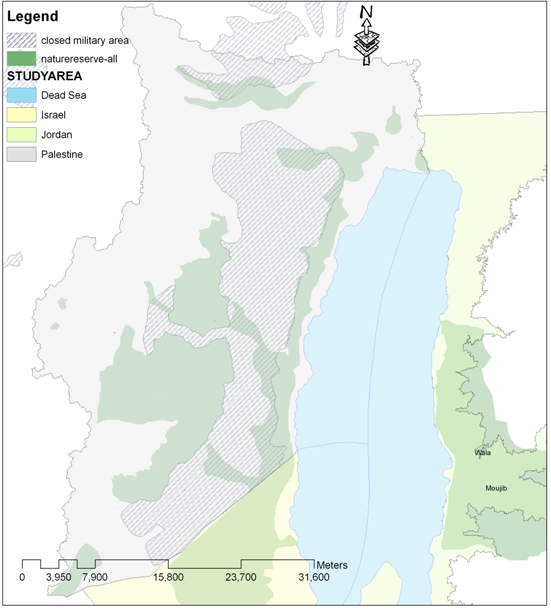
Map 1. Closed Military areas and Natural Reserves not accessible to the Palestinian Farmers.
In the Palestinian part of the study area, the number of livestock is totally out of balance with the available grazing, which has suffered serious mismanagement. The impact of overgrazing on the vegetation is evident from the excessive uprooting of the green matter (grass and bushes), leading to reduced seeding, reduced regeneration, and the consequent loss of plant production in the next year. Also, there is a change in the floristic composition and a decline in volume and frequency of plants. The decline in volume of plants have been demonstrated through the analysis of satellite images. Figure 3 shows an overall persistent decline in average natural green biomass (g/m2) in the study area.

Figure 3: Observed overall drop in Biomass in both Spring and Summer Seasons.
However, the trend of change in biomass productivity was dissimilar in different areas. Map 2 below shows the changes in Biomass between the years 1985 and 2004. Shades of green indicate an increase in biomass whereas red shades indicate a decrease in biomass from the year 1885 to the year 2004. The red shaded areas are pastures open to grazing whereas the shades of green are areas declared as either natural reserves or closed military areas closed to grazing. Accordingly, the pastures open to grazing had to sustain 215,000 grazing sheep and goats which have led to overgrazing and pasture deterioration.
Map2: Shades of red are varying levels of loss of biomass, an indicator of degradation. Blue-Green Shades are increasing biomass.
Industry
The main industries in the Dead Sea Basin are found along the shores of the salting lakes. The Israeli industries located on the Western shores of the Salting lakes consumed approximately 35 MCM of water, 29% of which is fresh water supplied by Mekorot Company and the remaining is brackish water abstracted from wells. Table 3 shows industrial water consumption by source of water for the industries in the Israeli part of the study area. The Jordanian industries, mainly the Potash Company, located on the eastern shores is also another large consumer of water. Current consumption is approximately 12.5 MCM and is project to increase in the near future to a little more than 14 MCM. Palestinian industries in the study area are small businesses mainly of Food and Beverage industries, Stone Queries and Factories and Textile industries. These are located further from the Dead Sea shores on the Eastern Slopes of the Mountain ridge. The overall water consumption by the Palestinian industries is less than 1 MCM/yr.
Table 3: Water consumption by source of water for the industries in the Israeli part of the study area
| Industry Name |
Mekorot (Fresh Water) |
Brackish Wells |
fresh water reservoir |
Total consumption in 1000 CM |
| Dead Sea works |
21 |
21235 |
85 |
21341 |
| The dead Sea bromine company |
588 |
529 |
0 |
1117 |
| Rotem-Amphert Negev |
9598 |
3244 |
0 |
12842 |
| P.M.A development of energy systems |
6 |
0 |
0 |
6 |
| Ta'abura cement containers company |
4 |
0 |
0 |
4 |
| Negev industrial minerals |
0 |
0 |
0 |
0 |
| Dayagey Ein-Tamar |
0 |
444 |
0 |
444 |
| Dan Rolider |
0 |
0 |
0 |
0 |
| Matmenot company |
0 |
0 |
0 |
0 |
| Total |
10217 |
25453 |
85 |
35755 |
|