Hydro-Geology
Groundwater Basins
The study area lies over 3 groundwater basins; these are:
1-The southern part of the Eastern Mountain Basin
2-The Dead Sea Basin located in the Jordanian part of the
study area
3-The southern part of the Jordan Valley Floor Basin.
The Eastern Mountain Basin
The 800 m thick Mountain aquifer is hyddrogeologically the
main karstic aquifer in the areas West of the Dead Sea.
Three subaquifers are developed in this area:
1- A Shallow Turonian Aquifer feeding some springs such as
Wadi-El-Qilt springs,
2- An Upper Cenomanian Aquifer which is penetrated by wells;
and
3- A Lower Cenomanian-Albian Aquifer which is penetrated by
wells.
The Eastern Mountain Basin covers an area of
about 3,080 km2 and
includes the eastern part of the Mountain Belt and the steep
Western Escarpment of the Jordan Rift Valley. Groundwater
is recharged by precipitation at an average volume of 172
MCM/yr, and flows generally in a southeastward direction toward
the Jordan Rift Valley and the Dead Sea. Other estimates
of the annual groundwater recharge of the entire Eastern Basin
are 125 MCM/yr (WSSPS, 2000) and 135.9 MCM/yr (CH2MHILL, 2002).
However, the current abstraction rate plus annual spring flow is
171.1 MCM/yr divided between the Palestinian (69.8 MCM/yr) and
the Israelis (101.3 MCM/yr) (CH2MHILL, 2002).
The southern part of the Eastern Mountain
Basin covers
an area of about 1,652 km2.
Natural recharge areas of the lower and upper Cenomanian
aquifers in the study area were obtained from the Hebrew
University of Jerusalem. The total replenishment
areas of the upper, lower and Turonian aquifers are 617 km2
, 69 km2 and 70 km2,
respectively. The recharge volumes were roughly estimated by
overlaying the replenishment areas with average annual
precipitation. The connection between replenishment (R) and
precipitation (P) was based on previous studies conducted in the
study area (Guttman, 2000). The connection between replenishment
and precipitation is:
(1) for p<300 mm/yr: R = 0.15p
(2) for 650 mm/yr > p > 300 mm/yr: R = 0.534(p-216)
(3) for p > 650 mm/yr: R = 0.8(p-360)
Accordingly, the estimated natural recharge
in the Palestinian part of the study area was found to be 61,
16.2 and
9.5 MCM/yr for the upper, lower Cenomanian and turonian aquifers,
respectively. The natural discharge from the Eastern Aquifer is through springs and by
flow into deeper aquifers (2-3 MCM/yr) and into the Dead Sea
(3-4 MCM/yr). Three major
springs discharge water into the Dead Sea, these are: Fescha,
Kane (Ghwair) and Samar (Turba). Several other smaller
freshwater springs exist in the study area such as Ein Al
Sultan. Guttman and Simon (1984) summarized discharge
measurements along the Dead Sea. The discharges were
approximately 34.2, 17.75 and 10 MCM/yr in Fescha, Ghwair and Turba
Springs. Discharge measurements from the smaller springs are
approximately 18.7 MCM/yr.
Overlay of the Lithology Map with the
recharge areas map (Map 1) have shown that the recharge areas are
primarily composed of limestone, chalk and Chert formations
(Table 1).
Table 1. Lithology of the recharge areas.
|
LITHOLOGY |
Area (Sq Km) |
|
Limestone, marl, Dolostone; 171 m |
337.6 |
|
Limestone, Dolostone, Marl, Chalk, Chert |
147.2 |
|
Chalk, Chert; 164m |
130.3 |
|
Limestone, dolostone, marl, chalk,
Chert; 227 m |
103.4 |
|
Dolostone; 160 m |
68.4 |
|
Conglomerate Units, undif |
7.1 |
|
Chert, chalk, phosphorite, limestone; 86 m |
6.9 |
|
Aragonite varves, sandstone, gravel, conglomerate, mudstone,
gypsum; 32 m |
5.9 |
|
Limestone, marl, chalk, sandstone; 670 m |
4.7 |
|
Gravel, sand, clay, loess |
1.4 |
Map 1. Lithology of Recharge Areas
The Dead Sea Groundwater Basin
The Dead Sea Basin covers an area of about 1,525 km 2 and lies
within three physiographic divisions— the Jordan Rift Valley,
Jordan Highland and Plateau, and the escarpments of the Jordan
Rift Valley. The Jordan Rift Valley is a pronounced geologic
depression formed by downward movement of faults.
Groundwater is recharged by precipitation at an average volume
of 57 MCM/yr, and generally flows toward the Dead Sea.
Groundwater is the principal source of freshwater in the basin
and is withdrawn primarily from the Amman–Wadi Sir aquifer
system, consisting of limestone and Chert.
The Southern part of the Jordan
Valley Floor Basin
The Jordan Valley Floor Basin is located in the floodplain of
the Jordan River south of Lake Tiberias. The entire basin is
contained in the Jordan Rift Valley, a pronounced geologic
depression in which elevations range from 210 to 400 m below sea
level. The basin is underlain by alluvial deposits of soil,
sand, and gravel, marl, and clay that infill the rift valley to
a thickness of at least 2,200 m. Groundwater is recharged
by precipitation at an average volume of 21 MCM/yr (EXACT,
Overview of Middle East Water Resources). The part of the
Jordan Valley Floor Basin located in the study area extends 11
km north of the Dead Sea and has an average width of
approximately 40 km. The total area is therefore
approximately 440 km2 .
Precipitation in the southern part of the valley floor averages
170 mm/yr (Range 125 mm/yr - 240 mm/yr) whereas potential
evaporation averages approximately 1,830 mm/yr. Recharge
of groundwater in the southern part of the Jordan Valley is
therefore minimal.
Groundwater Abstraction &
Spring Discharges
The
Eastern Mountain Aquifer
Table 2 shows the average yearly abstraction of water from
wells. Mekorot Company operates several wells in the
Palestinian (9wells) and Israeli (6 wells) parts of the study
area. The West Bank Water Department, on the other hand,
operates 7 wells in the study area. The Palestinian Water
Authority was operating 8 wells in 2003 and is developing a
number of wells with a total estimated annual abstraction volume
of 13.9 MCM. The actual production of the 8 operational
wells in the years 2002 and 2003 however was well below their
estimated yield. Total abstraction from the Eastern Mountain
aquifer was 46.72 MCM/yr without accounting for abstraction from
Moan 1 well and from 53 low yield agricultural wells. Actual
total abstraction from Eastern Basin might be around 50 MCM/yr.
Map 2 shows the location of wells in the eastern mountain
aquifer.
Table 2. Average yearly abstraction from the water wells in the study area.
|
Water Authority |
Average Yearly
Abstraction (MCM/yr) |
|
Mekorot
Water Company*,*** |
23.88 |
|
West Bank Water
Department |
7.8 |
|
Palestinian
Water Authority |
3.69 |
|
New Wells
Palestinian Water Authority (Operational in 2002) |
1.98 |
|
New Wells
Palestinian Water Authority (Implementation Phase) |
13.87 |
|
Palestinian
Municipal Wells |
0.5 |
|
Agricultural
Wells** |
5.2 |
|
Brackish
Wells*** |
32.5 |
|
Total
Abstraction from Water Wells |
79.22 |
*No data is available for Moan 1 Well
** The number of Agricultural wells is approximately 95 wells.
Yearly abstraction volume data is available for 42 of these
wells. Some of the remaining 53 wells are still
operational, these are shallow wells (50-100m) with low yields.
*** 2.5 MCM/yr of High Quality water are abstracted in the Tamar
administrative Region by the water Company Mekorot but an
additional 10.2 MCM of Fresh water and 32.5 MCM
of Brackish water are also abstracted from the Tamar region to
the west of the Eastern Mountain Aquifer. All other wells
are located in the Palestinian Territory.
Map2. Location of water wells in the study area.
Water quality from groundwater wells is generally good but is
deteriorating. Elevated levels of abstraction from the
aquifer increased water salinity and chloride concentration (See
Figure 1 for an example on increase in chloride concentration). In addition, nitrate levels are increasing indicating pollution
from the open discharge of untreated domestic wastewater.
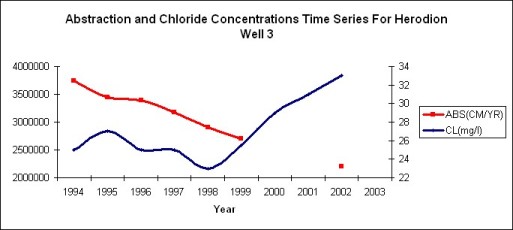
Figure 1. Chloride concentration as observed in Herodion 3
well
The most
productive well fields in the study area are the Herodion well
field, the Jericho Well Field and the Beni Neim well field.
Water abstraction in the Jericho and Herodion well fields
started in the 70s. The drilling and operation of more
wells in the Herodion well field caused a significant decrease
in the water table level as observed in the log head data of the
wells in the area. Figure 2 shows the drop in the water
level in three wells. Herodion 2 water level was dropping
at an average of approximately 1.5 meters per year whereas
Herodion 4 well was dropping at an average of 3 meters per year.
The case of Hebron 1 well is most striking. The water
level in Hebron 1 well dropped from 357 m to 315 m.
Figure 3 is a three
dimensional representation of the drop in water level observed
in the lower Cenomanian aquifer of the Herodion Well Field. In
figure 3, the blue layer is a three dimensional representation
of the water table level of the lower Cenomanian Aquifer in the
year 1980. The Grey layer, on the other hand, is a three
dimensional representation of the water table level in the year
1999. The elevation values in the three dimensional
representation are magnified by a value of five for a better
visual representation. The drop in the water level ranges
between 3 and 80 meters with a spatial average of approximately
14 meters.
 Figure 2. Drop in water level in the Herodion Well Field
Figure 3. A three
dimensional representation of the drop in water level observed
in the lower Cenomanian aquifer of the Herodion Well Field.
The drilling of new wells in
the Herodion well field is most probably going to increase the
rate of drop in the water table level. In the year 1998,
the abstracted volume of water from the Herodion Well Field was
approximately 11 MCM. The designed annual discharge of the
new PWA wells (PWA-1, PWA-3, PWA -11 and Hindaza) drilled in the
Herodion Well Field is 5.2 MCM/year (CH2MHILL) and the expected
yield from the JWC-4, Azzariya 1 and Azzariya 2 drilled in
proximity to existing wells in the Herodion Well field is
approximately 5.4 MCM/yr (Scarpa, 2004). This will bring
up the total volume abstracted from the Herodion Well Field to
approximately 21.6 MCM/yr. The actual abstraction however
is not expected to reach such high yields. In the year
2002, the abstracted volume from the PWA-1, 3, 11 and Hindaza
wells was only 3.44 MCM which is equivalent to 66% of the
designed annual discharge and to 46% of the pump test rate
(Scarpa, 2004). As the current abstraction volumes exceed the
aquifers sustainable yield, the designed annual discharge volume
of the new PWA wells, Hebron 1 and Hebron 2 wells will be
referred to herein as a non-usable resource on the long run. the
drilling of new wells in the Herodion well field is most
probably going to increase the rate of drop in the water table
level.
Waters from the Herodion Well Field and
Beni-Neim well field are fresh whether they are tapped from the
Upper or from the Lower Cenomanian Aquifers. In the
Jericho Well field, waters tapped from the Upper Cenomanian
aquifer are fresh whereas waters tapped from the lower aquifer
are Brackish with Cl concentrations above 1,000 mg/l. All
the wells tapping from the Upper Cenomanian aquifer pump fresh
water suitable for drinking, only Jericho 1 and 2 have very high
Chloride content and have to be mixed with waters from other
wells before supply for drinking. The wells Mizpe Jericho
3 and 5 and Jericho 2 and T-12 have been abandoned due to high
salt concentrations.
Several Springs discharge water from the
Eastern Basin. Historic discharges from springs were
approximately 82 MCM/yr. However, abstraction of water
from wells has reduced water discharges from springs. 32
water springs are found in the study area, 27 of which discharge
an average volume of 18.7 MCM/yr whereas the three springs of
Fashkha, Ghwair and Turba discharged prior to development of
groundwater wells approximately 50 MCM/yr. Of the 27 springs,
the springs of Ein Qilt, Ein Fawwar and Ein Sultan are the
largest. Ein el Sultan is characterized by a very steady
discharge of 180 l/s (Eq. 5.7 MCM/yr), the combined discharge of
Ein-Qilt and Ein Fawwar averages 150 l/s with occasional peaks
in the winter months up to 2,000 l/s. The annual discharge
of the three springs averages approximately 13 MCM/yr. The
remaining springs are smaller springs and are used exclusively
for watering shepherd animals or for agricultural purposes. Except for Fashkha, Ghwair and Turba springs, all other spring
waters in the study area are fresh with a TDI content of 8-11
meq/l.
The Dead Sea Groundwater Basin
The annual recharge of the Dead Sea Basin was estimated at 57
MCM/yr (EXACT Project). Incomplete data exists as regards
to the level of water abstraction from groundwater wells.
However, in the project's study area (See Map 3), 27 groundwater
wells exist. These are mostly concentrated south of the
Dead Sea. The total annual abstraction from the wells in
the study area is approximately 5 MCM/yr (Source ECO Consult
Office). Over abstraction in the Dead Sea groundwater
basin as in the Eastern Groundwater Basin is a problem.
The water level in several water wells dropped by more than 15
meters in the last 20 years.
In the Eastern reaches of the aquifer water is of good to fair
quality, with total dissolved solids concentrations between 300
and 1,000 mg/L. Concentrations generally are greater in the
western part of the aquifer system (750–1,250 mg/L) than in the
eastern part (500 mg/L). In localized areas, such as the lower
reaches of the Wadi Mujib, concentrations are as high as 1,500
mg/L. Water quality generally deteriorates in an eastward
direction where the aquifer becomes more confined.
Map 3. The Dead Sea Project Study Area
83 springs with an average annual discharge of 39 MCM/yr are
located in the Dead Sea Groundwater Basin. Chloride
concentrations range between 40-1900 mg/l. Chloride
concentrations generally increase in an eastward direction.
|