European Commission Fifth RTD Framework Programme

A 
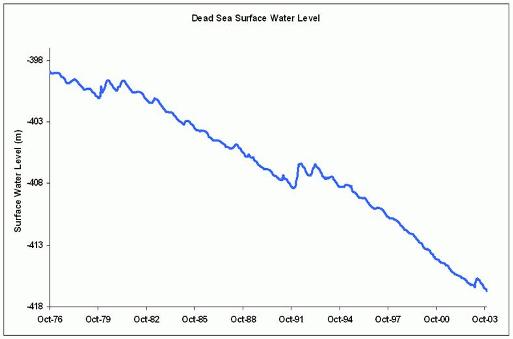
Future for The Dead Sea: Options for a More Sustainable Water Management

 The Project Threats  Results Consortium  Team Links     BACK To MAIN PAGE

 
Search the Website
The Project
 

Introduction

Objectives

Approach

Methods & Building Blocks

Water Uses

Threats

Factors

Preliminary Results


Physiography & Climate

Surface Water

Groundwater

Water Imports/Exports

Water Uses

Wastewater

Peoples' Attitudes and Perceptions

Biodiversity

Land Use and Land Cover

Data and maps


Population Distribution

Surface Water Harvesting

Groundwater Wells and Springs

Water Uses

Land use/cover change

Biomass Change (1985-2004)

Water Balance Sheet

What's new

News

Publications and reports

Question of the Week

Focus Group Meetings

Scenario Management Tool

Dynamic Synthesis Model

Essential Needs of Nature

Proposal for Interdisciplinary Research Integration

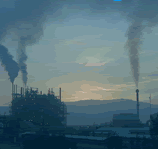
Industrial Pollution: The Dead Sea Works


Threats


Threats


A Dropping Water Level

     The water level of the Dead Sea has declined over 21 m from 1930 to 1997, and alone 12 m in the last 20 years. In less than a century the water level has fallen by approximately 25 m. In the past few years, the water level fell at a rate of 80-100 cm per year, with the average rate of fall accelerating in recent years. As a result, the Dead Sea surface area has shrunk by about 30% in the last 20 years.


Observed Drop in the water level of the Dead Sea between 1967 and 2003

arrowblue.gif (273 Byte) Top

Sinkholes

     It is not only the Dead Sea that is living up to its name, but the environment of the whole Dead Sea Basin is degrading.  Many scientists say that as water drains away from the Dead Sea, the porous rocks beneath the region are drying out. It means the rocks are no longer able to support the weight of those above them and subside under the pressure. As a result, sinkholes and land subsidence have opened up along the shoreline, caused by lowered water tables and groundwater over-exploitation. Furthermore, the decline of the Dead Sea also affects the freshwater springs on its shores (e.g. Ain Fashkha, Ain Turiba) that support a unique biodiversity.


Map of location of sinkholes and a pictures showing the relative size of sinkholes as compared to man

arrowblue.gif (273 Byte) Top

Depletion of Groundwater

      Several well fields in the study area are currently being overexploited.   While the safe yield of groundwater in the Western Dead Sea Basin is estimated at 64.6 MCM from the Upper Cenomanian Aquifer and 20.1 MCM from the Lower Cenomanian Aquifer (+/- 20%), the current abstraction from water wells plus spring discharges sums up to approximately 118.4 MCM/yr, about 40 % above the safe yield. The current levels of water abstraction from water wells will most likely further lower the water table. Particularly given the fact that plans exist to further exploit groundwater in the basin through new water wells.


Drop in groundwater level as observed in the Herodion Well Field (The example presented here is for Herodion 3,2&4 Wells).


arrowblue.gif (273 Byte) Top


Pollution

    Pollution from the open discharge of wastewater is a problem all over the basin and is likely to exacerbate with population growth and changes in consumption trends.  Consumption trends will most likely rise in the near future, especially if the 380,000 Palestinians that currently live below poverty line are given the opportunity to raise their material standard of living. Population increase and changes in consumption patterns will increase demand for water and the volume of generated wastewater.  The volume of untreated sewage flowing into the Dead Sea from the surrounding urban areas  are projected to increase from about 15 MCM/yr to as much as 35-50 MCM/yr. Such developments will have severe threat to the natural and cultural resources of this ecologically sensitive area (see for example the wastewater flowing from Jerusalem and Bethlehem to the Dead Sea through Wadi Nar).


 Wastewater Analysis Results of water quality collected from Wadis with    wastewater streams, October 2003

Parameter

Wastewater Collection Sites

in the West Bank

Bethlehem District

Hebron District

Wadi En Nar

Wadi As Samen

BOD (ppm)

400

624

TSS (ppm)

537

1370

Chloride (ppm)

223

575

Nitrate (ppm)

1.74

2.27

Nickel (ppm)

0.027

0.041

Cadmium (ppm)

0.029

0.030

Chromium (ppm)

0.014

1.278

Lead (ppm)

0.000

0.000

Zinc (ppm)

0.515

0.339

pH

7.18

7.82


The Wastewater Stream of Wadi Nar (Location: X-coord =716521.31 ,

Y-coord =3512704.92 / Date:April-2004)


arrowblue.gif (273 Byte) Top


Links