Introduction
The dynamic synthesis
model will bring together the system integration model and results from
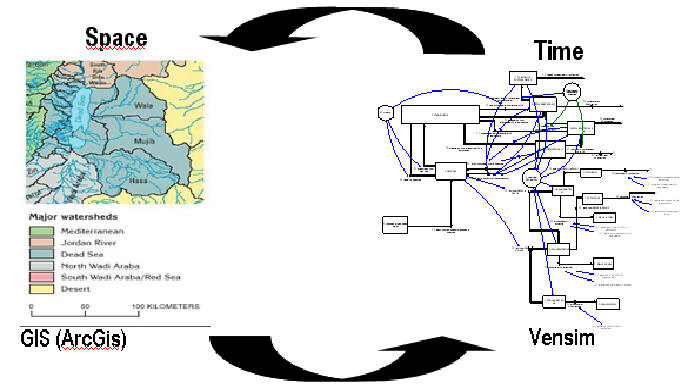
scenario synthesis. The dynamic model will be made with a system
dynamic modeling tools, “Vensim”, and it will be linked with a GIS
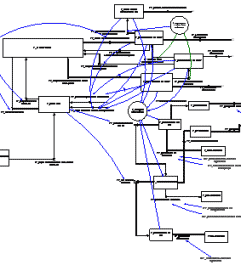
(ArcGIS). Figure 1 is a graphical presentation of the link between
the System Integration and the GIS.
Figure 1. The link between GIS and System Integration
The
scenarios were constructed and
the Scenario Management tool
is in its final stages of development. The system integration
model, on the other hand, attempts to understand the water system of the
Dead Sea Area through the integration of three subsystems; namely the
physical system, the water governance system and the social-economic
system (Figure 2).
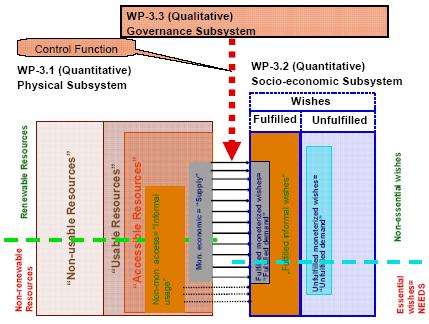
Figure 2: A schematic
diagram showing the interaction of the three
subsystems and agreed upon nomenclature of system components.
The
physical system
described the
physical dimension of water supply and use (plus driving forces) and the
consequences on the environment (particularly nature, land/soil, and
groundwater). The social system covers the social and economic
issues of water use in a systemic approach, it attempts to understand
the fulfilled versus the unfulfilled essential water needs and the
non-essential water wishes. These are assumed to have a substantial
effect on water abstraction and sustainable versus unsustainable use of
resources. The Governance subsystem will describe the policies on
national and regional levels, including institutional aspects of water
policy. It will also address the issue of driving forces for policy
changes. Other issues that will be included are: traditional water
rights, water policies in IL, JO, PS, players, role and power of
stakeholders, international dimension, conflicts of interest. The system
aspect that will be considered is the connection between policies
(regional, communal, local) and the driving forces for them,
particularly the role of economic factors, of NGO interest groups, and
of communities.
Work on
the three systems (physical, social and economic) started by developing
causal loop diagrams to provide a top-down view of the three systems to
provide an understanding of the interactions between the elements of
each system and between the three systems. For example, The
physical subsystem has been divided into 7 components which are:
groundwater resources, surface water resources, climatic conditions,
wastewater, water use, water infrastructure/utilities, and land use.
Each of these subcomponents affects other subcomponents. Moreover,
they are directly affected and affect the other two subsystems:
socio-economic subsystem and policy subsystems.
The
construction of the causal loop diagrams which describes the nature of
interactions (e.g. synergistic versus antagonistic) between the
different components was followed by the construction of stock and flow
diagrams with defined quantities and mathematical expressions linking
the various components. Work on the stock and flow diagrams has
been completed. However, access to the stock and flow diagrams
will be restricted to project partners and the funding agency. The
diagrams, the integration of the Scenario Management tool with system
integration model and with GIS will be available to researchers through
proper publications towards the completion of the project.
|