European Commission Fifth RTD Framework Programme
![]() A
Future for The Dead Sea: Options for a More Sustainable Water Management
A
Future for The Dead Sea: Options for a More Sustainable Water Management
| The Project |
|
|
|
|
|
|
|
|
European Commission Fifth RTD Framework Programme |
| |||||||||
| ||||||||||
|
|
|
|||||||||
|
|
||||||||||
|
The Project |
Preliminary Results
|
Data and maps |
What's new
Proposal for Interdisciplinary
Research Integration |
Agricultural Landscape in West-northern Dead Sea coast |
|
|
|
|
|
|
NIS (Israel New Shekel): 1 NIS= 0,194 Euro, Bank of Israel 14.5.2003
In the study area, the decline of the Dead Sea is directly correlated with the diversion of water in the upper Jordan watershed. The National Water Carrier, that diverts water from the Sea of Galilee to provide irrigation and municipal water to most parts of the country has caused the Jordan River to practically cease to flow; the result is a declining Dead Sea.
Tourism, agriculture and industry are the most important economic sectors when it comes to water use in the study area. Most of the water is expropriated from groundwater and springs, that left untapped, would flow into the Dead Sea. Figure 1 describes the water consumption for agriculture in the two regional authorities in the study area. The first, the Tamar Regional Authority is located within pre-1967 Israel, the second; Megillot Regional Authority is located within post-1967 Israel. Table 2 describes the domestic water allocated to both regional authorities by Mekorot.
Figure 1: Water consumption in irrigation (Tamar and Megilot regions)
Table 2: Domestic water allocated to the regional authorities in Israel
Most of the wells in the study area that are owned and operated by Mekorot are of drinking water quality but are used primarily for irrigation. The Dead Sea Works, by the far the largest industry in the region and the largest consumer of water in the region, is one of the few private entities in Israel that owns and operates its own water resources. To date, the company has been unwilling to share its data with the public but as a proxy for water consumption by the company we have used the capacity of water reservoirs that are operated by the company which amounts to 5,400,000 cubic meters.
Most of all available water in the area is used for irrigation of agricultural crops. This, however, generates only limited economic benefit. The agricultural sector uses about 65-70 % of water, but it contributes only about 4 % to employment, and only 2 % to GDP. In comparison, the industrial sector contributes 22 % to employment and 13.3 % to GDP.
Every cubic meter of water consumed in the agricultural sector results in export revenues of 0.27 Jordanian Dinars (JD) per m3, compared to 122 JD/m3 for industries. In other words, water is approximately 145 times more productive in industry than it is in agriculture.
Water resources in the Dead Sea Basin consist primarily of surface and ground water resources. However, due to the political situation, Palestinians have little access to these resources. Water demands are partially met by groundwater abstractions and by purchasing water from the Israeli "Mekorot" Water Company (Table 3).
Table 3:Ground water resources and water supply for Palestinian Communities in the Dead Sea area (Source: PWA, 2002). Numbers given in million cubic meters (MCM) per year.
Water quality index: Note: Numbers do not include Mekorot wells supplying the IL Settlement.
It should be noted, however, that actual water demand is much higher than actual water supply (Table 4). About 55 % of water (i.e. 21.3 MCM/yr from groundwater and 0.7 MCM/yr from surface water) is allocated to the agricultural sector (Figure 2). The total area of Palestinian irrigated agriculture is approximately 20,780 dunums (about 2100 hectares), most of it in and around Jericho city. The contribution of the agricultural sector to Palestinian GDP is about 8 % (2001 data).
Table 4: Agricultural, municipal and industrial water demand for the Palestinian population in the Dead Sea Basin with 38% physical loss in water supply (current value), with the physical loss reduced to 20% and with the physical loss reduced to 10%. Domestic water demand was based on the minimum fresh water requirements of 100 l/c/d as set by the World Health Organization. All numbers given in million cubic meters (MCM) per year.
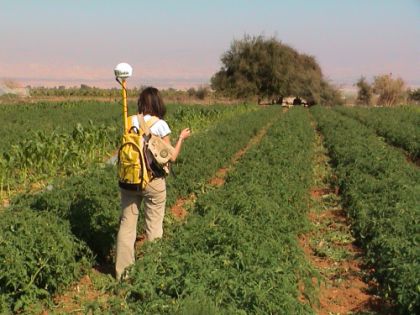
Figure 2: A tomato field in Jericho City / April 2004
The total municipal water allocation for Palestinian communities in the study area is about 16.95 MCM/yr, of which the tourism sector had received 0.16 MCM, the livestock economy 1.75 MCM, public use 0.9 MCM, and domestic use (drinking water, hygiene, etc) 14.3 MCM.
|
|
|
||||||||||||||||||||||||||||||||||||||||||||||||||||||||||||||||||||||||||||||||||||||||||||||||||||||||||||||||||||||||||||||||||||||||||||||||||||||||||||||||||||||||||||||||||||||